If T4A season feels chaotic, it’s tempting to jump straight to solutions:
“Let’s buy new software.”
“Let’s outsource it.”
“Let’s just work harder next year.”
But before you change anything, it helps to understand **how your process actually works today**—where information starts, how it flows, and where it slows down or breaks.
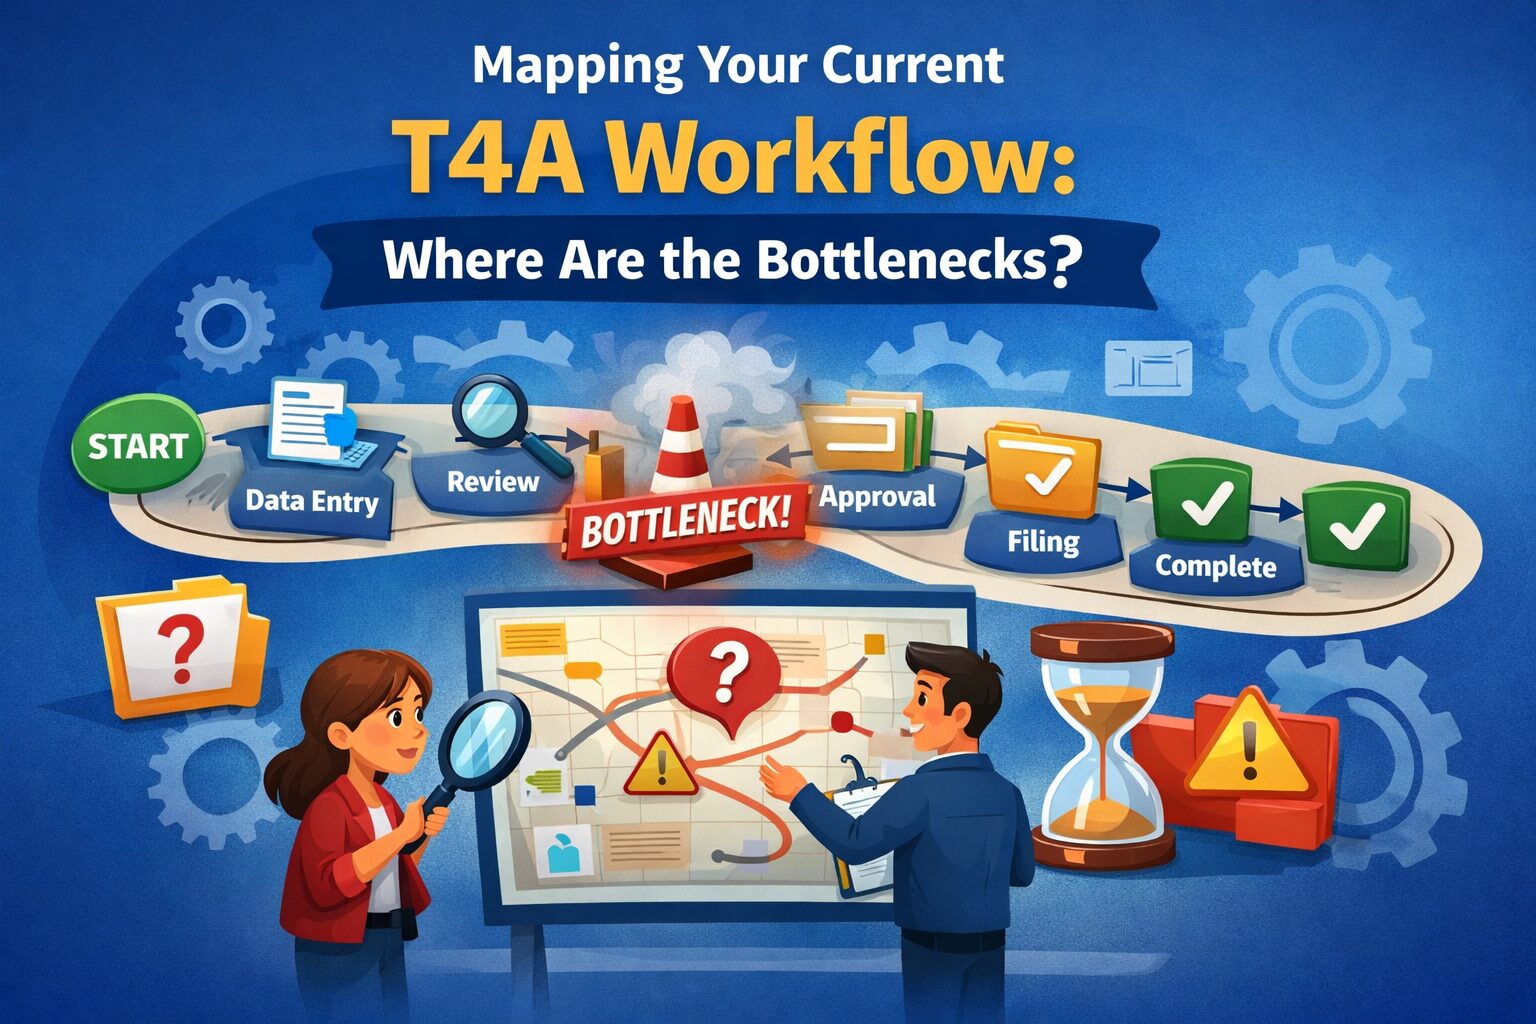
That’s where workflow mapping comes in. It’s not about fancy diagrams; it’s about making the invisible visible so you can fix the right problems in the right order.
Here’s a simple way to map your T4A workflow and spot bottlenecks.
1. Start with a simple question: “From where to where?”
Your T4A workflow moves information from:
> **“We paid contractors during the year”**
> to
> **“We filed accurate T4A slips with CRA and sent them to recipients.”**
Everything in between is process.
To map it, gather a small group of people who touch T4A work—finance, admin, maybe a department manager—and ask:
– “What’s the very first step in our T4A process?”
– “What’s the very last step?”
Write those down. That gives you your start and finish.
2. Brain-dump all the steps—without worrying about order
Next, ask everyone to list **every task** they do related to T4As, however small. For example:
– Exporting contractor payments from the accounting system
– Cleaning and reformatting spreadsheets
– Emailing coaches or managers to confirm who they used
– Chasing contractor SINs and addresses
– Filling out CRA web forms or upload files
– Printing, emailing, or uploading slips
Write each unique step on its own sticky note (physical or digital). Don’t worry about sequencing yet.
3. Put the steps in order from left to right
Now that you have ingredients, build the recipe.
On a whiteboard or digital board, arrange the steps in the order they usually happen, from:
– **Left:** “Pull raw data from our systems”
– **Right:** “Submit to CRA and send slips to recipients”
It doesn’t need to be perfect—just “mostly true.” Create swimlanes if helpful, such as:
– Data and reports
– Contractor info and communication
– Review and approvals
– Filing and distribution
You’ve just created a **visual map** of your current T4A workflow.
4. Mark where things consistently slow down
With the map in front of you, ask the group:
– “At which steps do we spend the most time?”
– “Where do we feel stuck or blocked each year?”
– “Where do we see the most back-and-forth?”
Common bottlenecks include:
– Identifying all contractors who need a T4A
– Cleaning messy or inconsistent payment data
– Collecting missing SINs and addresses under time pressure
– Getting internal approvals from busy managers or partners
– Manually entering data into CRA forms or clunky templates
Mark these bottlenecks on the map with a symbol or colour. These are your **priority areas for improvement**.
5. Identify handoff points (where work changes hands)
Bottlenecks often occur where work is passed between people or teams. On your map, highlight where:
– Finance hands off to an external accountant
– Admin staff wait for managers to confirm contractor lists
– One person prepares data and another files with CRA
Ask:
– “Where do things sit in someone’s inbox for days?”
– “Where are we unclear about who is responsible for the next step?”
Improving clarity and expectations at handoff points can often relieve pressure without changing any tools.
6. Label your tools at each step
Next, add the systems and tools you’re using at each stage. For example:
– Accounting system (for example, QuickBooks, Xero, Sage)
– Spreadsheets (Excel, Google Sheets)
– Email and shared drives
– CRA’s web forms or upload tools
– T4ASlip or other T4A-focused software (if you already use one)
This helps you see where:
– The same data is re-entered multiple times
– People switch between too many tools
– A better tool could eliminate manual work
It also shows you where a tool like **T4ASlip** could plug in to replace fragile spreadsheet steps.
7. Ask “What would perfect look like?” (without constraints)
Before you get into what’s realistic, give your team a minute to imagine a **frictionless T4A process**. For example:
– Contractor data always complete and up to date
– Clear contractor totals available with one report
– T4A slips generated in bulk from clean data
– Minimal manual typing, fewer emails, fewer surprises
Compare that ideal to your current map. The gap shows you where improvements will bring the most value.
8. Pick 2–3 high-impact fixes for the next cycle
You don’t have to redesign everything at once. Based on your map, choose 2–3 improvements that will make the biggest difference. For example:
– **Upstream data improvements**
– Standardize how contractor payments are coded in your accounting system.
– Collect SINs and addresses at onboarding instead of in January.
– **Process clarity improvements**
– Assign a clear T4A “owner” and define roles for everyone else.
– Set and communicate internal deadlines several weeks before CRA’s.
– **Tooling improvements**
– Introduce T4ASlip to replace some or all of your manual spreadsheet steps.
– Use simple forms instead of unstructured emails for data collection.
Set realistic goals: “For this coming season, we will fix *these things* and observe the impact. Next season, we’ll pick the next group.”
9. How T4ASlip plugs into your mapped workflow
Once you’ve mapped your process, it’s much easier to see where automation like T4ASlip can help. Typical touchpoints include:
– Importing contractor data and payment summaries directly from your accounting system
– Centralizing contractor profiles so you’re not retyping the same info every year
– Highlighting missing or inconsistent data before you even start creating slips
– Generating T4A slips and summaries in a consistent, CRA-aligned format
Instead of being “just another tool,” T4ASlip becomes the **backbone** of your T4A workflow—replacing fragile sections of your map and freeing your team to focus on judgment, not manual mechanics.
10. Turn your map into a living playbook
Finally, don’t let your map live on a whiteboard that gets erased after the meeting.
– Save a digital version (even a simple flowchart or screenshot).
– Attach it to your T4A checklist or year-end playbook.
– Update it each year as you refine your process and tools.
Over time, you’ll see your workflow evolve from a messy set of habits into a documented, improving system. That’s the foundation of a T4A process that’s faster, less risky, and much less stressful.
In short: mapping first, then fixing
If T4A season feels painful, don’t assume the answer is just “work harder” or “buy software.” Start by mapping what you actually do today. Once you see where the bottlenecks are, you can apply the right mix of process changes and tools—like T4ASlip—to relieve pressure where it matters most.